Widgets
Widgets are the main building blocks at SEIOO. They work as small machines and micro services that together on a view makes up "the application".
A widget is a self-contained analytical unit that behaves like a small machine or micro-service. When multiple widgets are combined inside a View, they collectively form what is effectively the application itself: a live, interactive analytics system tailored to the user’s needs.
Instead of hard-coded dashboards, SEIOO is composed of flexible widgets that can be created, modified, combined, and reused across different views and workflows.
Widget Types
SEIOO currently supports the following widget types:
Charts
Visual, time-based representations of data such as price, indicators, composites, correlations, or macro series.
Cards
Compact widgets designed to surface a single value, state, or summary, such as latest price, score, status, or signal.
Tables
Structured, multi-row widgets used for rankings, breakdowns, comparisons, or datasets that require scanning rather than charting.
Each widget type is optimized for a different cognitive task: charts for trends, cards for quick decisions, and tables for structure and comparison.
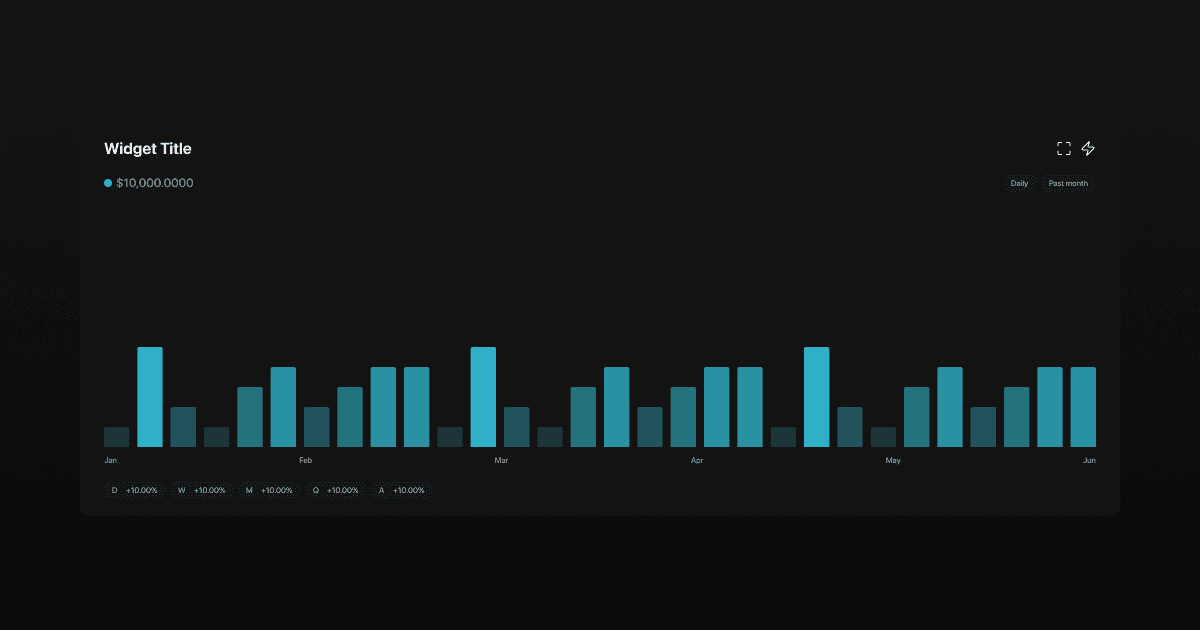
Chart Widgets
Visual, time-based representations of data such as price, indicators, composites, correlations, or macro series.
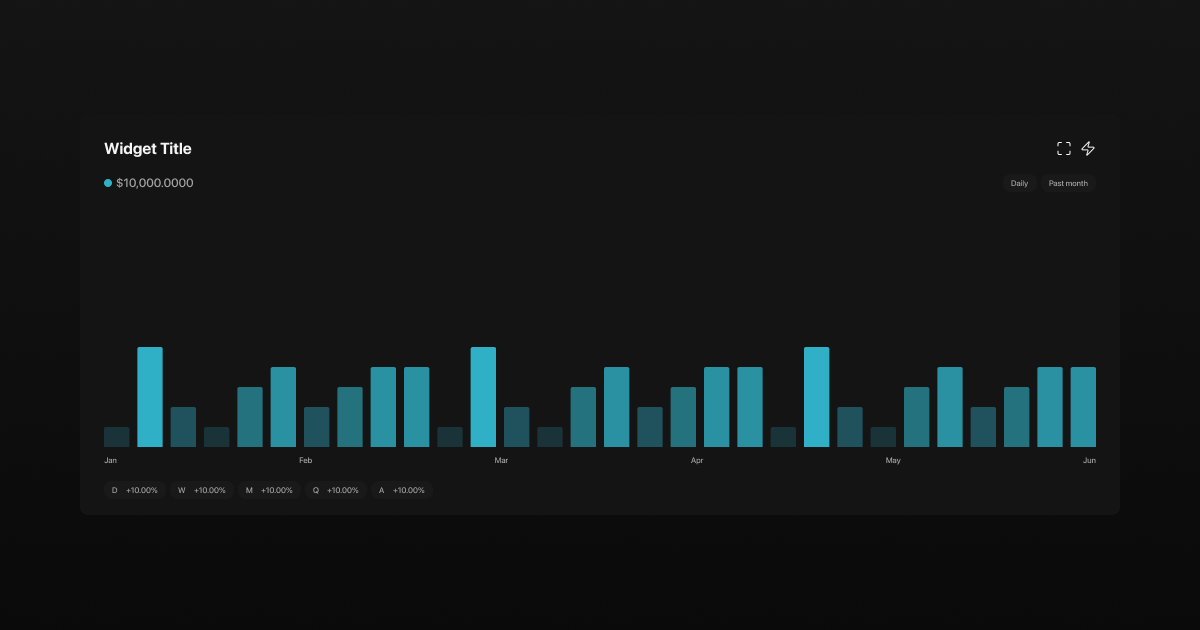
Chart widgets are used when you want to see how something evolves over time, compare movements, or understand structure and regimes.
Example: Simple Price Monitoring
Prompt
“Show BTC price on a weekly chart for the past 3 years”
Result
Line chart
BTC price
Weekly timeframe
3-year period
Latest value visible
Use case: long-term trend monitoring.
Structure and Content
Chart widgets are composed of these components:
Title
Live Indicator
Latest Value
Expand (Save as PNG in Expanded Mode)
Builder (Settings)
Timeframe
Daily
Weekly
Monthly
Quarterly
Annually
Period
This Week
This Month
This Quarter
This Year
Past Week
Past Month
Past Quarter
Past Year
Past 3 Years
Past 5 Years
Max (All Data)
Content
Cartersian Charts
Line
Bar
Area
Scatter
Pie Charts
Radial Charts
Radar Charts
Polar Charts
Donut Charts
Heatmap
Treemap
Indicators (+100 as layovers)
Change Values
Card Widgets
Compact widgets designed to surface a single value, state, or summary, such as latest price, score, status, or signal.
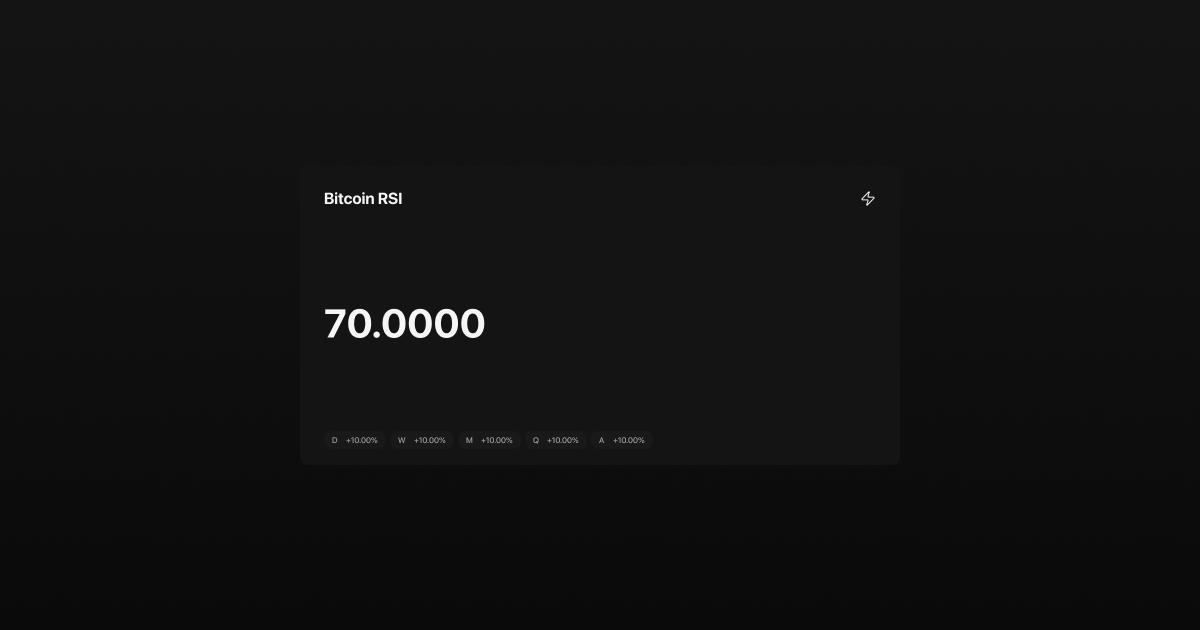
Card widgets are used when you want one number or state, not a chart.
Example 1: Latest Price
Prompt
“BTC latest price as a card”
Result
Single large value
Current BTC price
Optional daily change
Use case: quick glance monitoring.
Structure and Content
Card widgets are composed of these components:
Title
Latest Value
Builder (Settings)
Change Values
Table Widgets
Structured, multi-row widgets used for rankings, breakdowns, comparisons, or datasets that require scanning rather than charting.
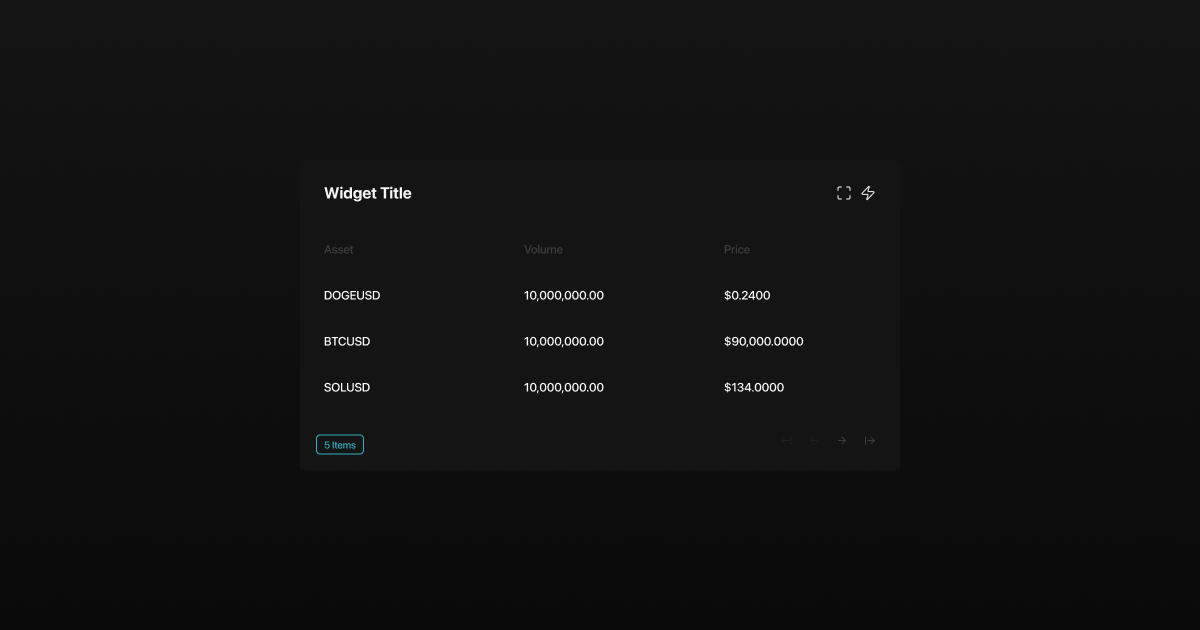
Table widgets are used when you need to scan, compare, rank, or filter multiple items.
Example 1: Asset Ranking
Prompt
“Rank top 20 crypto assets by 30-day performance”
Result
Table with rows = assets
Columns = return, price, change
Use case: relative performance scanning.
Structure and Content
Table widgets are composed of these components:
Title
Expand
Builder (Settings)
Structured Data (Columns and Rows)
Was this helpful?